

Azure Functions Premium Plan and Service Bus Tuning Cheat-Sheet
In this article, we introduce a structured approach to optimizing message throughput between an Azure Function and Azure Service Bus.
Efficient message processing from Azure Service Bus queues using Azure Functions depends on fine-tuning three key settings:
- FUNCTIONS_WORKER_PROCESS_COUNT - the number of separate worker processes per function host instance, configured via the
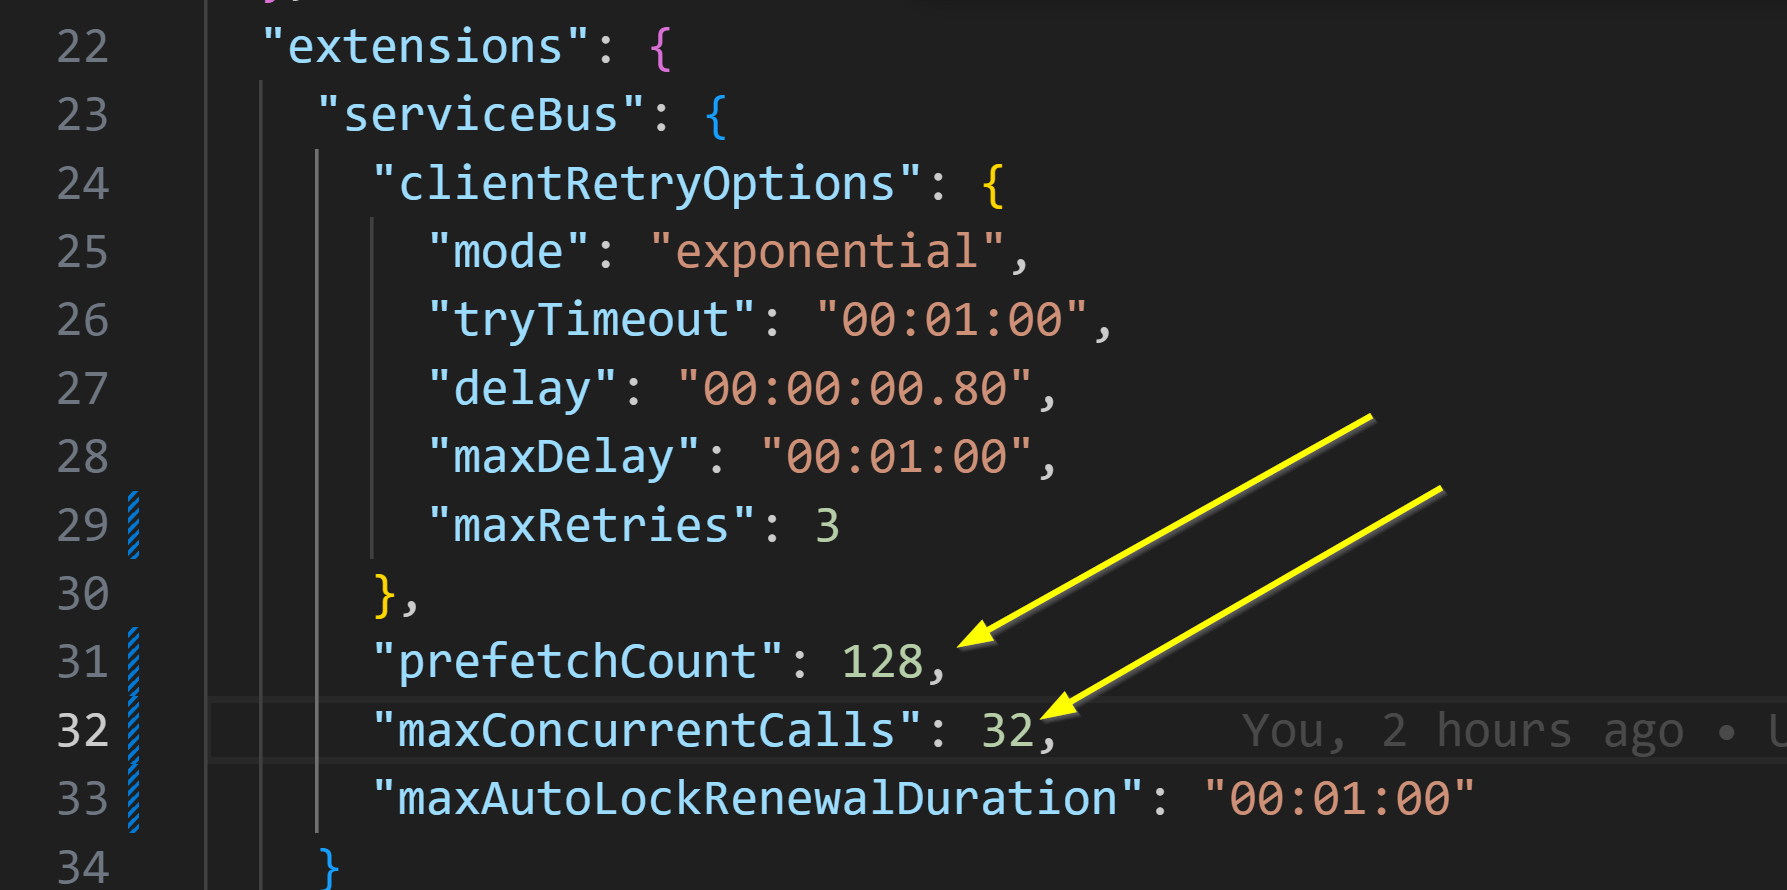
FUNCTIONS_WORKER_PROCESS_COUNTapp setting. - maxConcurrentCalls - the number of messages processed in parallel by a single function instance, configured in host.json
- prefetchCount - the number of messages fetched in advance, configured in host.json
- maxBurst - the limit on sudden spikes in concurrency, configured in the portal, from Azure CLI or from your IaC
FUNCTIONS_WORKER_PROCESS_COUNTcontrols the number of separate worker processes (for language isolation and reliability) but does not multiply yourmaxConcurrentCalls. Concurrency is governed by the setting on the host instance.
The method below provides a way to estimate initial values for each setting based on the type of workload, with adjustments made over time based on actual resource usage and downstream system performance. This approach assumes messages are lightweight, up to 10 KB in size.
2. Workload-Based Configuration
This section outlines how to choose initial values for maxConcurrentCalls and prefetchCount based on the type of workload your Azure Function is handling. Different workloads-whether limited by I/O, CPU, or memory-require different tuning strategies to make the best use of available resources.
Jump to section 2.1 At-a-glance table for a solved puzzle!
| Scenario | maxConcurrentCalls | prefetchCount |
|---|---|---|
| I/O-bound | 32 * vCPU | 4 * maxConcurrentCalls |
| CPU-bound | [vCPU - [0.6 * 1 + 1 * (vCPU - 1)]] / cpuPerExecution (%) | 2 * maxConcurrentCalls |
| Memory-bound | [(RAM (GB) - 2) / memoryPerExecution (GB)] | 0 |
| Balanced | 8 * vCPU | 2 * maxConcurrentCalls |
- vCPU: number of virtual CPUs
- RAM: total memory in GB
- memoryPerExecution: average memory footprint of one execution.
- cpuPerExecution: average CPU footprint of one execution.
To estimate
cpuPerExecutionandmemoryPerExecution, start by settingmaxConcurrentCalls: 1,prefetchCount: 0and max burst to 1 (from the portal), then monitor the resource usage as outlined in section 6. Signals to watch and tune.
2.1 At-a-glance table
This table shows starting values for maxConcurrentCalls and prefetchCount on the Azure Functions Premium tiers (EP1 - EP3). Use it as a shortcut once you know whether your workload is mainly limited by I/O, CPU, or memory. For CPU and memory bound scenarios, substitute your measured cpuPerExecution (%) and memoryPerExecution (GB) to calculate the final numbers.
| Workload Type | EP1 (1 vCPU / 3.5 GB) | EP2 (2 vCPU / 7 GB) | EP3 (4 vCPU / 14 GB) |
|---|---|---|---|
| I/O-bound | maxConcurrentCalls: 32 prefetchCount: 128 | maxConcurrentCalls: 64 prefetchCount: 256 | maxConcurrentCalls: 128 prefetchCount: 512 |
| CPU-bound | maxConcurrentCalls: 0.4 / cpuPerExecution prefetchCount: 0.8 / cpuPerExecution | maxConcurrentCalls: 0.4 / cpuPerExecution prefetchCount: 0.8 / cpuPerExecution | maxConcurrentCalls: 0.4 / cpuPerExecution prefetchCount: 0.8 / cpuPerExecution |
| Memory-bound | maxConcurrentCalls: 1.5 / memoryPerExecution prefetchCount: 0 | maxConcurrentCalls: 5 / memoryPerExecution prefetchCount: 0 | maxConcurrentCalls: 12 / memoryPerExecution prefetchCount: 0 |
| Balanced | maxConcurrentCalls: 8 prefetchCount: 16 | maxConcurrentCalls: 16 prefetchCount: 32 | maxConcurrentCalls: 32 prefetchCount: 64 |
For CPU and Memory bound workload types, plugin your
cpuPerExecutionandmemoryPerExecutionto get the result.
3. Scaling Beyond the initial values
This section describes how to fine-tune and safely scale your Azure Function after deploying the initial configuration. The goal is to gradually increase throughput without overloading system resources or downstream services.
- Initial Ramp-Up
- Increase
maxConcurrentCallsby 10%-20% from their base values. - Continue until either:
- CPU or memory utilization reaches 70 %
- message ingestion rate shows no further gain
- external target can not handle the load
- Increase
- Handling Resource Exhaustion
- On function restart due to out-of-memory or CPU saturation:
- Reduce
maxConcurrentCallsandprefetchCountby 10 %. - Introduce or raise a moderate
maxBurstlimit to absorb sudden spikes.
- Reduce
- On function restart due to out-of-memory or CPU saturation:
- I/O-Bound Considerations
- Confirm that downstream services can handle the peak load.
- On HTTP 429 or other transient errors, inspect the
Retry-Afterheader:- If present, defer retry by that interval
- If absent, delay retry by 30 seconds
4. Best Practices
- Slow and steady wins: small, incremental changes prevent overshooting resource limits.
- Graceful back-off for I/O: respect downstream constraints to avoid cascading failures.
- Visibility: hook into Application Insights or Azure Monitor to track key metrics and alert on restarts.
By starting with workload-aware defaults and adjusting based on real-time feedback, you can maximize throughput while safeguarding both your function app and any dependent services.
5. dynamicConcurrencyEnabled and snapshotPersistenceEnabled (auto-tuning with persistence)
Azure Functions can manage trigger concurrency automatically. Enabling dynamicConcurrencyEnabled: true in host.json lets the Functions runtime tune the degree of parallelism for you. This is supported for Service Bus triggers (requires extension v5.x). Key points:
- With dynamic concurrency on, the host starts each function at 1 concurrent execution and adjusts up to an optimal value based on real-time performance metrics. It monitors CPU, thread pool saturation, etc., and will throttle incoming messages (pause fetching) if an instance is overloaded.
- Static settings like
maxConcurrentCallsandmaxConcurrentSessionsare ignored when dynamic concurrency is active – the system finds the best concurrency level automatically. You can therefore omit these settings or leave them at default. - To use effectively: enable it and let it run for a while under typical load. Monitor the Function logs (look for
Host.Concurrencytraces) to see how it’s scaling concurrency. This can achieve optimal throughput without manual tuning, especially in workloads with variable performance characteristics. If using dynamic concurrency, you may keep PrefetchCount moderate (or default) – the system will fetch messages as needed.
To maintain tuning across host restarts or scale operations, you can enable snapshot persistence:
{
  "extensions": {
    "serviceBus": {
      "dynamicConcurrencyEnabled": true,
      "snapshotPersistenceEnabled": true
    }
  }
}
- snapshotPersistenceEnabled: When set to
true, the runtime periodically saves its current concurrency snapshot (the optimal concurrency value and related metrics) to durable storage. After a restart or scale-out, it reloads this snapshot to resume with near-optimal throughput immediately, avoiding the slow ramp-up phase. - Persistence frequency: The Functions host writes snapshots at regular intervals (typically every few minutes) and immediately before a clean shutdown.
- Fail-safe behavior: If a persisted snapshot is unavailable (for example, on first start or if persistence fails), the host reverts to a conservative ramp-up-starting at one execution and scaling to the optimal level.
Using these two settings together provides near–hands-off tuning: the Functions runtime continuously adjusts concurrency for you and remembers the previous best configuration, even if your app scales or restarts.
6. Signals to Watch and Tune
Once your Azure Function is deployed and running, ongoing monitoring is essential to maintain performance and catch problems early. Azure provides rich observability tools, especially through Application Insights and Azure Monitor, that help you understand how your function behaves under different loads. Here are the key signals to focus on, and how to interpret them.
Key Metrics in Application Insights (Step-by-Step)
CPU Usage
- Navigate to your Function App in the Azure Portal.
- In the left-hand menu, select Application Insights.
- Click "Metrics" at the top.
- In the chart configuration:
- Scope: Ensure your Function App is selected.
- Metric Namespace: Choose Functions or App Service Standard Metrics.
- Metric: Select
CPU TimeorCPU Percentage. - Aggregation: Use
AvgorMaxfor trends. - Split by: Optionally split by instance for more granular analysis.
- Set the time range to 1h, 24h, or 7d to observe trends.
- Watch for: Sustained CPU usage over 70% → time to scale out or reduce concurrency.
Memory Usage
- In the same Metrics blade:
- Metric: Select
Memory Working Set(shows the actual memory used).
- Metric: Select
- Check memory trends for spikes or consistently high usage.
- Watch for: Usage near the total available RAM (e.g., 3.5 GB on EP1) → indicates overload or memory leaks.
- In the same Metrics blade:
Exceptions
Go back to Application Insights, and click on "Logs" (or open Log Analytics).
Use the following query to view recent exceptions:
exceptions
| order by timestamp desc
Filter by operation name, severity level, or custom dimensions to find relevant failures.
Watch for: Frequent exceptions or repeating patterns - can indicate message format issues, dependency failures, or capacity limits.
Service Bus Throughput
- In the Azure Portal, go to your Service Bus Namespace.
- In the left-hand menu, click "Metrics".
- Add the following metrics to the chart:
Incoming MessagesOutgoing Messages
- Select the same time range and aggregation (e.g.,
Sum). - Watch for: A growing gap between incoming and outgoing - suggests the function is falling behind.
Dead-letter Queue (DLQ)
- In the Service Bus Namespace, select your queue or subscription.
- In the left-hand menu, click "Dead-letter Messages" under Metrics or view the "Overview" tab.
- To inspect DLQ contents:
- Use Service Bus Explorer (available in the Azure Portal).
- Or connect with a tool like Azure Storage Explorer or a custom script.
- Watch for: Sudden spikes in DLQ count - usually tied to repeated processing errors.
Pro Tip: Build a Custom Dashboard
- In the Azure Portal, click Dashboard (top menu).
- Click + New dashboard, then Add a tile.
- Select Metrics chart, Logs chart, or Custom query.
- Pin your most important metrics: CPU %, Memory, Exceptions, Service Bus Throughput.
- Click "Alerts" in each resource (Function App, Service Bus):
- Set thresholds (e.g., CPU > 70%, DLQ count > 10).
- Choose notification channels (email, Teams, webhook, etc.).
This will give you a real-time view of your system and help catch issues before they become incidents.